WhatsApp:
+353 87 202 0389

The Junior Cycle Maths Syllabus is a really important piece of literature to read ahead of the exams in June. The Junior Cycle Maths syllabus contains everything you need to know in order to sit the exam, and hence, everything you need to know to succeed!
That said, the Junior Cycle Maths syllabus you’ll find on the SEC website is really long and convoluted, so it can be difficult to know exactly what you need to know.
So, we’ve gone ahead and broken down the Junior Cycle Maths Syllabus for you right here, so that you’ll have a place to start making your study plan so that you can smash those tests in June!
Junior Cycle Maths Syllabus Structure
The Junior Cycle Maths syllabus and curriculum can be broken down in a number of different ways, but in its simplest terms, there are four aspects you need to think about:
- Coursework
- Classroom-Based Assessments (CBAs)
- Assessment Task
- Final Assessment (a.k.a. the exam in June)
Some of these sections are also interlinked. The coursework is relevant to every aspect, naturally, because you cannot complete the CBAs, Assessment Task, or the exam if you don’t understand the basic concepts. The Assessment Task is a reflection on the second CBA, and that counts towards your final grade along with the final assessment, so there’s not really any opportunity to take a shortcut if you want to do well!
That being said, the Junior Cycle Maths syllabus is a lot less daunting once you understand it completely, and in this blog we’re going to break it down from start to finish.
Junior Cycle Maths Course Overview
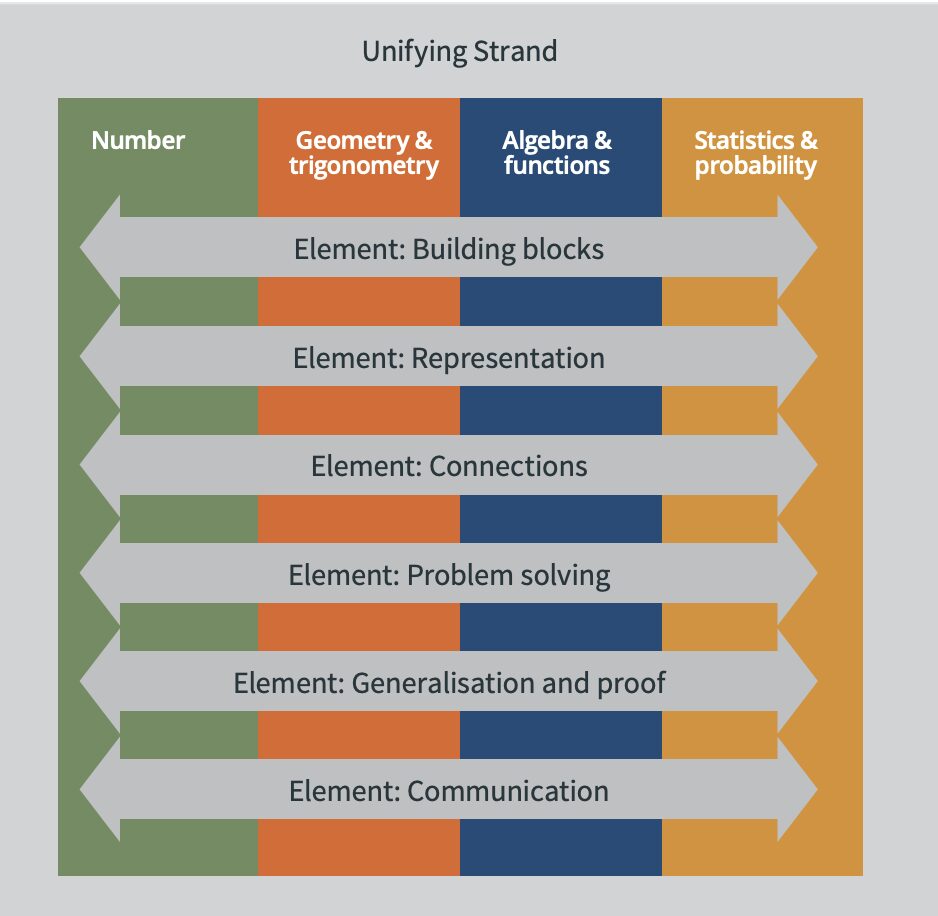
According to the Junior Cycle Mathematics Specifications released by the Department of Education and Skills, the Junior Cycle Maths syllabus focuses on “developing students’ ability to think logically, strategically, critically, and creatively through the Unifying strand and the four contextual strands: Number; Geometry and trigonometry; Algebra and functions; and Statistics and probability.”
Source: Junior Cycle Mathematics Specification
In this section, we’re going to go into detail on each of the strands on the Junior Cycle Maths syllabus so that you’ll know the whole craic before the exam.
Unifying Strand
This part of the Junior Cycle Maths syllabus forms the foundation for every other part of the course. It overarches the other strands, so there is no specific content as such, but fulfilling the aims of the strand is crucial to success, especially in CBA 1. As part of the Unifying Strand, students should be able to:
- understand concepts learned in class and use them correctly
- answer questions in different ways, e.g. using a graphs
- make connections between strands and the real world
- think critically about problems
- present and evaluate arguments and proofs
Pretty straightforward, right? Now, within the four Contextual Strands, there are various so-called Learning Outcomes, which is basically just a fancy way of saying ‘things you need to know for the exam,’ and they’re a lot more specific, so we’ll take a look at each of those now.
Number Strand
This strand of the Junior Cycle Maths syllabus focuses on numbers – understanding the different types, how to work with them, what can be done with them, and how to present the result of various operations in different ways.
The table below shows the various knowledge and skills students should have after completing this strand. Anything in bold is relevant to Higher Level students only. We have simplified the academic jargon so that it’s easier to see whether you have mastered the Learning Outcome in question, and we’ve left a space to check it off so that you can print this off and put it into your study plan!
| Students should be able to | Simplification | ✅ | |
| N.1a | investigate the representation of numbers and arithmetic operations so that they can represent the operations of addition, subtraction, multiplication, and division in ℕ, ℤ, and ℚ using models including the number line, decomposition, and accumulating groups of equal size. | show how natural numbers, integers, and real numbers are added, subtracted, multiplied, and divided using different methods such as the number line, decomposition, and accumulating groups of the same size. | |
| N.1b | perform the operations of addition, subtraction, multiplication, and division and understand the relationship between these operations and the properties: commutative, associative and distributive in ℕ, ℤ, and ℚ and in ℝℚ , including operating on surds. | understand the relationship between operations like addition and properties such as commutative, associative, and distributive in terms of natural numbers, integers, real numbers, and irrational numbers (including surds). | |
| N.1c | explore numbers written as ab (in index form) so that they can: I. flexibly translate between whole numbers and index representation of numbers II. use and apply generalisations such as ap aq = ap+q (ap)/(aq) = ap-q (ap) q = apq n1/2 = √n for a ⋲ ℤ, and p, q, p-q, √n⋲ℕ and for a, b, √n ⋲ ℝ, and p, q ⋲ ℚ at HL III. use and apply generalisations such as a0 = 1 ap/q = q√ap = (q√a)p a-r= 1/(ar) (ab)r = arbr(a/b)r = (ar)/(br) for a, b ⋲ ℝ ; p, q ⋲ ℤ; and r ⋲ ℚ IV. generalise numerical relationships involving operations involving numbers written in index form V. correctly use the order of arithmetic and index operations including the use of brackets | use BIMDAS and rearrange equations that contain indices and use the laws of indices (page 21 of Formulae and Tables book) | |
| N.1d | calculate and interpret factors (including the highest common factor), multiples (including the lowest common multiple), and prime numbers | understand terms like factors (including HCL), multiples (inc. LCM), and prime numbers and spot them in questions | |
| N.1e | present numerical answers to the degree of accuracy specified, for example, correct to the nearest hundred, to two decimal places, or to three significant figures | present answers to questions as accurately as possible, e.g. correct to two decimal places | |
| N.1f | convert the number p in decimal form to the form a × 10n, where 1 ≤ a < 10, n ⋲ ℤ, p ⋲ ℚ, and p ≥ 1 and 0 < p < 1 | convert decimals to scientific notation | |
| N.2a | investigate equivalent representations of rational numbers so that they can flexibly convert between fractions, decimals, and percentages | convert to and from fractions, percentages, and decimals | |
| N.2b | use and understand ratio and proportion | understand ratio and proportion | |
| N.2c | solve money-related problems including those involving bills, VAT, profit or loss, % profit or loss (on the cost price), cost price, selling price, compound interest for not more than 3 years, income tax (standard rate only), net pay (including other deductions of specified amounts), value for money calculations and judgements, mark up (profit as a % of cost price), margin (profit as a % of selling price), compound interest, income tax and net pay (including other deductions) | understand basic financial maths (most relevant formulae are on pages 30 and 32 of Formulae and Tables book) with some additional knowledge at Higher Level | |
| N.3a | investigate situations involving proportionality so that they can use absolute and relative comparison where appropriate | know the difference between relative and absolute proportionality | |
| N.3b | solve problems involving proportionality including those involving currency conversion and those involving average speed, distance, and time | solve problems using proportions such as converting currency, distance-speed-time, etc. | |
| N.4 | analyse numerical patterns in different ways, including making out tables and graphs, and continue such patterns | understand patterns so that you can draw them out and continue them in graphs and tables | |
| N.5a | explore the concept of a set so that they can understand the concept of a set as a well-defined collection of elements, and that set equality is a relationship where two sets have the same elements | know what a set is and the basic properties of a set | |
| N.5b | define sets by listing their elements, if finite (including in a 2-set or 3-set Venn diagram), or by generating rules that define them | list the elements of a set and show what the elements of a set would be in rule form | |
| N.5c | use and understand suitable set notation and terminology, including null set, Ø, subset, ⊂ , complement, element, ⋲, universal set, cardinal number, #, intersection, ∩, union, ∪, set difference, , ℕ, ℤ, ℚ, ℝ, and ℝℚ | understand set terminology (mostly on page 23 of Formulae and Tables book) | |
| N.5d | perform the operations of intersection and union on 2 sets and on 3 sets, set difference, and complement, including the use of brackets to define the order of operations | solve for the value of the intersection of a set, set difference, and complement | |
| N.5e | investigate whether the set operations of intersection, union, and difference are commutative and/or associativ | show whether set intersection, union, and difference are commutative and/or associative |
Geometry and Trigonometry Strand
This strand of the Junior Cycle Maths syllabus focuses on 2D and 3D shapes, their properties, and how to answer questions on them. Again, we’ve created a table so you can see how well you’ve mastered the Learning Outcomes.
| Students should be able to | Simplification | ✅ | |
| GT.1 | calculate, interpret, and apply units of measure and time | understand, calculate, and use units of measurement and time | |
| GT.2a | investigate 2D shapes and 3D solids so that they can draw and interpret scaled diagrams | understand and draw diagrams of various shapes (mostly between pages 8 and 11 of Formulae and Tables book) | |
| GT.2b | draw and interpret nets of rectangular solids, prisms (polygonal bases), cylinders | understand and draw nets of various 3D shapes (mostly on pages 10 and 11 of Formulae and Tables book, more are examined at Higher Level) | |
| GT.2c | find the perimeter and area of plane figures made from combinations of discs, triangles, and rectangles, including relevant operations involving pi | find the perimeter and area of various 2D shapes and shape combinations (mostly on pages 8 and 9 of Formulae and Tables book) | |
| GT.2d | find the volume of rectangular solids, cylinders, triangular-based prisms, spheres, and combinations of these, including relevant operations involving pi | find the volume of various 3D shapes and shape combinations (mostly on pages 10 and 11 of Formulae and Tables book) | |
| GT.2e | find the surface area and curved surface area (as appropriate) of rectangular solids, cylinders, triangular-based prisms, spheres, and combinations of these | find the surface area and curved surface area of various 3D shapes and shape combinations (mostly on pages 10 and 11 of Formulae and Tables book, more are examined at Higher Level) | |
| GT.3a | investigate the concept of proof through their engagement with geometry so that they can perform constructions 1 to 15 in Geometry for Post-Primary School Mathematics (constructions 3 and 7 at HL only) | perform Constructions 1-15 and 3 and 7 at Higher Level (listed on pages 77 and 78 of Geometry for Post-Primary School Mathematics) | |
| GT.3b | recall and use the concepts, axioms, theorems, corollaries and converses, specified in Geometry for Post-Primary School Mathematics (section 9 for OL and section 10 for HL) I. axioms 1, 2, 3, 4 and 5 II. theorems 1, 2, 3, 4, 5, 6, 9, 10, 13, 14, 15 and 11, 12, 19, and appropriate converses, including relevant operations involving square roots III. corollaries 3, 4 and 1, 2, 5 and appropriate converses | use axioms 1-5, theorems 1-6, 9, 10, 11, 12, 13-15, and 19, corollaries 1, 2, 3, 4, and 5, and the relevant converses, in the solution of problems | |
| GT.3c | use and explain the terms: theorem, proof, axiom, corollary, converse, and implies | use and explain the relevant terms | |
| GT.3d | create and evaluate proofs of geometrical propositions | answer questions that ask you to (informally) prove something | |
| GT.3e | display understanding of the proofs of theorems 1, 2, 3, 4, 5, 6, 9, 10, 14, 15, and 13, 19; and of corollaries 3, 4, and 1, 2, 5 (full formal proofs are not examinable) | show understanding of proofs of relevant theorems and corollaries (you don’t have to produce the proofs themselves!) | |
| GT.4 | evaluate and use trigonometric ratios (sin, cos, and tan, defined in terms of right-angled triangles) and their inverses, involving angles between 0° and 90° at integer values and in decimal form | understand trigonometric ratios and inverses of right-angled triangles (mostly on page 13 of Formulae and Tables book) for acute angles how to put them in integer and decimal form | |
| GT.5a | investigate properties of points, lines and line segments in the co-ordinate plane so that they can find and interpret: distance, midpoint, slope, point of intersection, and slopes of parallel and perpendicular lines | understand the properties of a line in the co-ordinate plane to find various features (relevant formulae mostly on pages 18 and 19 of Formulae and Tables book) with some additional knowledge at Higher Level | |
| GT.5b | draw graphs of line segments and interpret such graphs in context, including discussing the rate of change (slope) and the y intercept | draw graphs of line segments and use graphs to find features such as slope and y intercept | |
| GT.5c | find and interpret the equation of a line in the form y = mx + c y – y1 = m(x – x1) ax + by + c = 0 (for a, b, c, m, x1, y1 ⋲ ℚ) including finding the slope, the y intercept, and other points on the line | find the slope, y intercept, and other points on the line to write the equation of a line in a variety of forms (relevant formulae mostly on pages 18 of Formulae and Tables book) | |
| GT.6a | investigate transformations of simple objects so that they can recognise and draw the image of points and objects under translation, central symmetry, axial symmetry, and rotation | recognise shapes that have been transformed by means of translation shapes, central symmetry, axial symmetry, and rotation, and know how to do it | |
| GT.6b | draw the axes of symmetry in shapes | draw the axes of symmetry in shapes |
Algebra and Functions Strand
Algebra forms a pretty big chunk of the Junior Cycle Maths syllabus, and a lot of students end up feeling very overwhelmed by it. Luckily, the breakdown makes things a lot less scary and it might help you figure out where to start tackling the problem.
| Students should be able to | Simplification | ✅ | |
| AF.1a | investigate patterns and relationships (linear, quadratic, doubling and tripling) in number, spatial patterns and real-world phenomena involving change so that they can represent these patterns and relationships in tables and graphs | understand algebraic patterns in a variety of contexts to be able to display them on graphs and tables | |
| AF.1b | generate a generalised expression for linear and quadratic patterns in words and algebraic expressions and fluently convert between each representation | write linear and quadratic expressions in words and algebraic form and convert from one to the other | |
| AF.1c | categorise patterns as linear, non-linear, quadratic, and exponential (doubling and tripling) using their defining characteristics as they appear in the different representations | know the difference between linear, non-linear, quadratic, and exponential patterns | |
| AF.2a | investigate situations in which letters stand for quantities that are variable so that they can generate and interpret expressions in which letters stand for numbers | understand variables as representations of unknown values to create and understand equations | |
| AF.2b | find the value of expressions given the value of the variables | find the answer to equations when given the value of the variables | |
| AF.2c | use the concept of equality to generate and interpret equations | understand expressions of equal value to create and understand equations | |
| AF.3a | apply the properties of arithmetic operations and factorisation to generate equivalent expressions so that they can develop and use appropriate strategies to add, subtract and simplify I. linear expressions in one or more variables with coefficients in ℚ II. quadratic expressions in one variable with coefficients in ℤ III. expressions of the form a(bx + c), where a, b, c ∈ ℤ | know how to add, subtract, divide, multiply, and factorise algebraic expressions in linear, quadratic, and fraction form | |
| AF.3b | multiply expressions of the form I. a (bx + cy + d)a (bx2 + cx + d)ax (bx2 + cx + d), where a, b, c, d ∈ ℤ II. (ax + b) (cx + d) and (ax + b) (cx2 + dx + e), where a, b, c, d, e ∈ ℤ | multiply algebraic expressions in a variety of forms (more are examined at Higher Level) | |
| AF.3c | divide quadratic and cubic expressions by linear expressions, where all coefficients are integers and there is no remainder | know how to correctly divide linear expressions into quadratic and cubic expressions | |
| AF.3d | flexibly convert between the factorised and expanded forms of algebraic expressions of the form: I. axy, where a ∈ ℤ II. axy + byz, where a, b ∈ ℤ III. sx – ty + tx – sy, where s, t ∈ ℤ IV. dx2 + bxx2 + bx + cax2 + bx + c, where b, c, d ∈ ℤ and a ∈ ℕ V. x2 – a2 and a2x2 – b2y2, where a, b ∈ ℤ | understand and recognise the different types of factorisation, including factorising by highest common factor, by grouping, finding the difference of two squares, and quadratic equations (more are examined at Higher Level) | |
| AF.4a | select and use suitable strategies (graphic, numeric, algebraic, trial and improvement, working backwards) for finding solutions to linear equations in one variable with coefficients in ℚ and solutions in ℤ or in ℚ | solve linear equations using the most appropriate method | |
| AF.4b | quadratic equations in one variable with coefficients and solutions in ℤ coefficients in ℚ and solutions in ℝ | solve quadratic equations using the most appropriate method | |
| AF.4c | simultaneous linear equations in two variables with coefficients and solutions in ℤ or in ℚ | solve simultaneous linear equations | |
| AF.4d | linear inequalities in one variable of the form g(x) < k , and graph the solution sets on the number line for x ∈ ℕ, ℤ, and ℝ | solve linear inequalities and plot them on the number line | |
| AF.5 | generate quadratic equations given integer roots | create a quadratic expression from the roots | |
| AF.6 | apply the relationship between operations and an understanding of the order of operations including brackets and exponents to change the subject of a formula | use BIMDAS to rearrange an equation | |
| AF.7a | investigate functions so that they can demonstrate understanding of the concept of a function | understand what a function is | |
| AF.7b | represent and interpret functions in different ways I. graphically (for x ∈ ℕ, ℤ, and ℝ, [continuous functions only], as appropriate) II. diagrammatically III. in words IV. algebraically V. using the language and notation of functions (domain, range, co-domain, f(x) = , f 😡 ⟼ , and y =) (drawing the graph of a function given its algebraic expression is limited to linear and quadratic functions at OL) | recognise, understand and show functions on graphs, on diagrams, in words, in algebraic terms, and in the language and notation of functions | |
| AF.7c | use graphical methods to find and interpret approximate solutions of equations such as f(x) = g(x) and approximate solution sets of inequalities such as f(x) < g(x) | find the intersections of graphs and the solutions to inequalities | |
| AF.7d | make connections between the shape of a graph and the story of a phenomenon, including identifying and interpreting maximum and minimum points | understand the characteristics of a graph and what that means in terms of the word problem attached to it |
If algebra is still causing you bother, you’re not the only one – it is the #1 topic students struggle with at Junior Cycle level. Luckily, at Breakthrough Maths, we have some of the brightest tutors in the country, and they’re all algebra whizzes. Check out one of our tutors below:
Isn’t Luke fantastic? We have plenty more tutors just like him who will be able to break algebra down for you and help you smash the JC. Book in for your free trial now to see what the hype is all about!
Statistics and Probability Strand
Statistics and probability are really manageable at Junior Cycle level, but at the same time, it’s vital that you nail it for Leaving Cert, where it becomes much more difficult, especially at Higher Level. We would definitely recommend using the checklist colum for this section of the Junior Cycle Maths syllabus!
| Students should be able to | Simplification | ✅ | |
| SP.1a | investigate the outcomes of experiments so that they can generate a sample space for an experiment in a systematic way, including tree diagrams for successive events and two-way tables for independent events | present the outcome of experiments in different ways | |
| SP.1b | use the fundamental principle of counting to solve authentic problems | apply the fundamental principle of counting to word problems | |
| SP.2a | investigate random events so that they can demonstrate understanding that probability is a measure on a scale of 0-1 of how likely an event (including an everyday event) is to occur | understand the meaning of probability | |
| SP.2b | use the principle that, in the case of equally likely outcomes, the probability of an event is given by the number of outcomes of interest divided by the total number of outcomes | understand that the probability of an event is the number of outcomes of interest divided by the total number of possible outcomes (when each is equally likely) | |
| SP.2c | use relative frequency as an estimate of the probability of an event, given experimental data, and recognise that increasing the number of times an experiment is repeated generally leads to progressively better estimates of its theoretical probability | use relative frequency to estimate probability and understand that increasing the number of trials increases likelihood of accuracy of that estimation of probability | |
| SP.3a | carry out a statistical investigation which includes the ability to generate a statistical question | come up with a statistical question for an investigation | |
| SP.3b | plan and implement a method to generate and/or source unbiased, representative data, and present this data in a frequency table | plan and carry out a method of investigation and/or find high-quality data and present it | |
| SP.3c | classify data (categorical, numerical) | recognise the investigation data as categorical or numerical | |
| SP.3d | select, draw and interpret appropriate graphical displays of univariate data, including pie charts, bar charts, line plots, histograms (equal intervals), ordered stem and leaf plots, and ordered back-to-back stem and leaf plots | select, draw, and draw conclusion from an appropriate graphical representation of your investigation data (more options at Higher Level) | |
| SP.3e | select, calculate and interpret appropriate summary statistics to describe aspects of univariate data. Central tendency: mean (including of a grouped frequency distribution), median, mode. Variability: range | describe the investigation data using statistical terminology (more options at Higher Level) and draw appropriate conclusions | |
| SP.3f | evaluate the effectiveness of different graphical displays in representing data | discuss the effectiveness of different representations of data | |
| SP.3g | discuss misconceptions and misuses of statistics | discuss misunderstandings around statistics and how they can be used incorrectly or unethically | |
| SP.3h | discuss the assumptions and limitations of conclusions drawn from sample data or graphical/numerical summaries of data | explain the assumptions that can be made from data and the shortcomings of those assumptions |
Another reason why being on top of statistics and probability is worth your while is so that you can do well in your CBA 2, which we are going to look at in the next section.
Classroom-Based Assessments (CBAs)
As part of the new Junior Cert, students must complete two CBAs in most of their subjects for both the Junior Cycle Profile of Achievement and the Assessment Task, which counts towards the final grade awarded by the SEC. The CBAs are important, but there is more of an opportunity to have some fun with them compared to other aspects of the course!
Neither CBA contribute directly to your final grade, but you are still assessed on them, the result of which you will receive alongside your grades on Results Day. Depending on the level of effort you put into your CBAs, you could be awarded any one of the following descriptors of achievement by your maths teacher: Exceptional, Above expectations, In line with expectations, or Yet to meet expectations.
Let’s have a look at what each of the CBAs entails!
CBA 1: Mathematical Investigation (MI)
CBA 1 takes place over a three-week period at the end of second year.
According to the Junior Cycle Mathematics Guidelines for the Classroom-Based Assessments and Assessment Task, the MI is an opportunity for students “to research a question they have about some phenomena of interest from the world around them or that they have come across in the course of their mathematical studies or their studies in other subjects.”
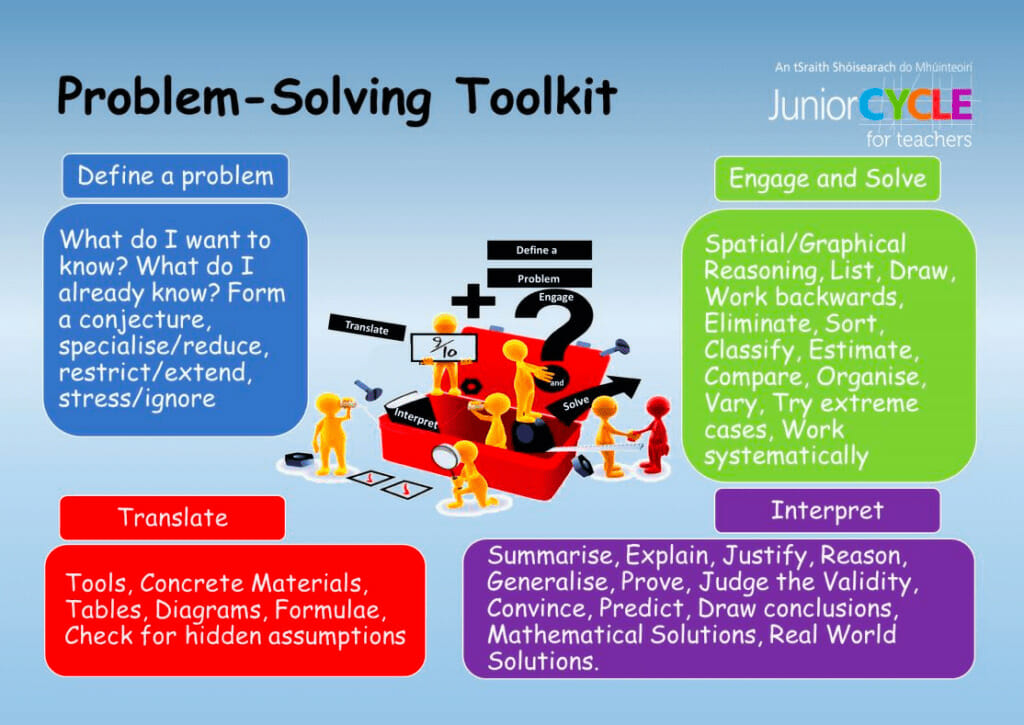
The Unifying Strand on the Junior Cycle Maths syllabus is especially relevant here. The problem-solving aspect is particularly important. As part of the task, students must investigate a mathematical problem, which involves four stages:
- Defining the problem statement
- Finding a strategy or translating the problem to mathematics
- Engaging with the mathematics to solve the problem
- Interpreting and reporting
Source: JCT.ie
Students report their research in a format of their choice at the end of the investigation, and this is then graded by their teacher according to the Features of Quality framework. We found a sample MI that received ‘Above Expectations’ for you to have a look at so you’ll know the sort of standard you want to be aiming for!
A more detailed breakdown of the stages of CBA 1, as well as more information about CBA 1, can be found on the JCT.ie website, but your teacher should go through this with you in detail when you begin the process.
CBA 2: Statistical Investigation (SI)
CBA 2 takes place some time at the end of the first term of third year, again over the course of three weeks.
This CBA is an opportunity for students “to carry out an investigation that involves varying data…(which) may be related to work they have encountered in other subjects or to a question they have about some quantitative phenomena of interest from the world around them.” (Department specifications)
Like we said before, the Statistics and Probability strand on the Junior Cycle Maths syllabus comes into play big time here. Indeed, the four stages of this CBA are closely linked to some of the Learning Outcomes for the strand:
- Designing the investigation
- Identifying the variables of interest and selecting the methods for gathering data
- Organising and managing the data
- Analysing and interpreting data summaries
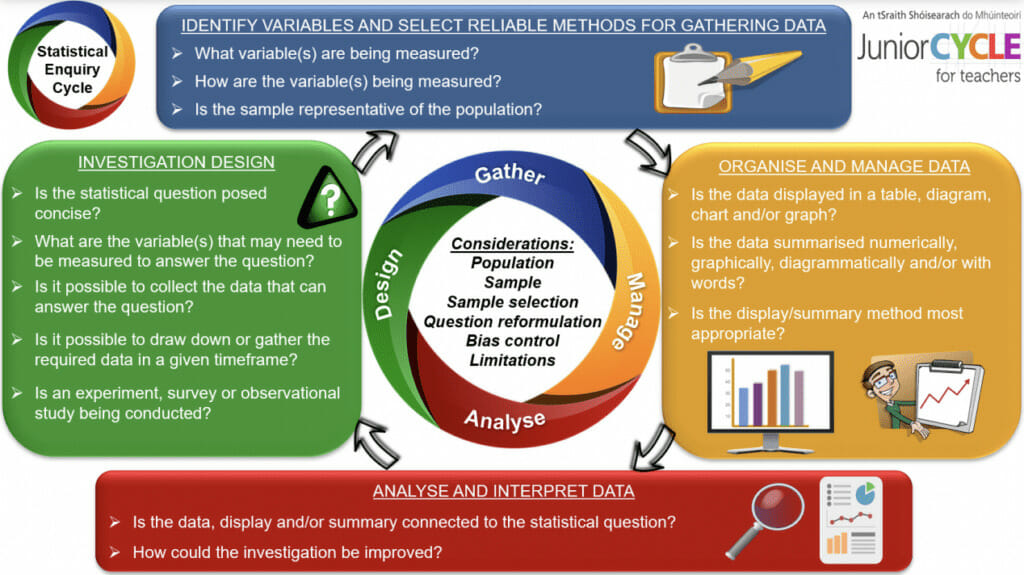
Source: JCT.ie
Again, the final product is a report that is presented to your teacher and graded according to this rubric. You’ll find further details on how to achieve the ‘Exceptional’ grade on the website, or by looking at this breakdown.
CBA 2 is essential to your success in the Assessment Task, which contributes towards your final grade, so it is well worth putting in the extra bit of effort here!
The Assessment Task
The Assessment Task can be the easiest 10% you’ll get in your life if you play your cards right.
That’s right, the Assessment Task is worth 10% of your final grade on the Junior Cycle Maths syllabus.
Put simply, it is a reflection on your CBA 2 (completed in class, often in a test-setting) that is sent off to the SEC to be marked. It is the quality of your reflection on the CBA, rather than the quality CBA itself, that will earn you marks here.
So, even if your CBA 2 doesn’t achieve the highest grade descriptor, if you put your best foot forward, keep all your research records, and write a really insightful reflection, you could walk away with 10% of your grade under your belt before you even walk into the exam in June!
Final Assessment
The final exam is arguably the most important aspect of the Junior Cycle Maths syllabus. It is a test of your mastery of the various Learning Outcomes and counts for 90% of your final grade.
Don’t think for a second that the grades you get in the Junior Cert don’t matter – while they don’t count towards CAO points, they may be relevant to applications for colleges in other countries, especially in the USA or even the UK. Furthermore, doing well in JC Maths sets you up for success in the Leaving, where it really matters.
The exam can be sat at either Higher or Ordinary level. Each paper lasts 2 hours and usually takes place at 9am on the first Friday of the exam period (if you want to double check, we posted this year’s Junior Cycle timetable here!)
Like many Junior Cycle papers, there aren’t a set number of questions on the paper each year, and not all questions carry equal marks.
If you follow the ‘Suggested maximum time’ printed in the top right-hand corner beside the beginning of the question, you should be left with about 10 minutes to review your work at the end of your exam – and then you are finished with Junior Cycle Maths!
Conclusion
The Junior Cycle Maths syllabus isn’t so bad once it’s all broken down, is it?
The main takeaway here is that the list of things you need to know at JC level is finite, so once you nail down each of the Learning Outcomes, you should be able to succeed in every aspect of the course.
But, we understand if you’re still a bit daunted by the whole shebang. If you feel like you haven’t mastered some of the Learning Outcomes, we can help you out. You can join our maths grinds for FREE to maximise your potential in maths!
T.J – CEO of Breakthrough Maths.
Book a Free Trial Grind. It will be the perfect tonic before the Junior Cert!